This post is a follow-up to Building Custom Node.js Streams: Splitting a 1GB File Without Running Out of Memory. You can read this one standalone, but the previous post is where the NumberWriter and LineToNumber streams came from and what problem they solve: taking a ~1GB file of newline-separated prime numbers and splitting it into smaller, more manageable files.
I closed that post on a bit of a cliffhanger. While profiling the final pipeline(), I noticed what looked like significant garbage collection thrashing, blamed the LineToNumber transform, and promised a follow-up where I’d dig in and fix it.
It took some time, but I finally got around to analyzing the implementation. I optimized the garbage collector thrashing, and also discovered it wasn’t really the performance problem that I thought it was. This led to further investigation that revealed a bottleneck hiding in plain sight. Overall, this post is a deep dive into constrained Node.js stream optimization from multiple perspectives.
NOTE
All the code from this post — the streams, the profiling harness, and the flame-graph and benchmark scripts — lives in the node-streams-numberwriter repo, under 02-profiling-and-writev/.
A quick recap of the suspect
The pipeline reads a big file, parses each line into a number, and feeds those numbers to a Writable that writes them back out across size-limited files:
await pipeline(
	createReadStream('primes-count-100-000-000.txt'),
	new LineToNumber(),
	new NumberWriter({ outputDir: 'primes-count-100-000-000' }),
);
If you think about it, why parse at all? We go from bytes, to numbers, and back to bytes, and the numbers are only ever turned back into the exact same ASCII digits they started as. If the only goal was to split the file, why ever switch from Buffer type data? You could forward newline-delimited slices straight through, or even simpler, rotate output files at newline-aligned byte offsets and never construct a single intermediate object. No objectMode, no parsing, no allocation.
That byte-to-byte approach is the right answer if splitting is all you want, and I want to acknowledge it up front. But it sidesteps the more interesting question. NumberWriter exists because plenty of sources produce actual numbers (the primeGenerator() from the last post being the obvious one), and a transform that genuinely needs to parse numbers out of text is a real and recurring shape. In this case this is a relatively simple transform, but what if it was more complex? So the question I actually care about is this: can a parsing transform be made efficient, instead of thrown away?
Here’s the _transform I suspected, unchanged from last time:
_transform(chunk: Buffer, _encoding: string, callback: TransformCallback) {
	let j = 0;
	for (let i = 0; i < chunk.length; i++) {
		if (chunk[i] === 10) {
			const slice = Buffer.copyBytesFrom(chunk, j, i);

			if (this.#prev) {
				this.push(
					parseInt(this.#prev.toString('utf8') + slice.toString('utf8'), 10),
				);
				this.#prev = undefined;
			} else {
				this.push(parseInt(slice.toString('utf8'), 10));
			}

			j = i + 1;
		}
	}

	if (j !== chunk.length) {
		this.#prev = Buffer.copyBytesFrom(chunk, j);
	}

	callback(null);
}
Eyeballing it, each line looks like it makes three throwaway objects: the Buffer slice, the .toString() string, and the parsed number. Three objects times a hundred million lines is three hundred million short-lived allocations, which sounds like a garbage collection nightmare. But “looks like” and “sounds like” aren’t measurements. Let’s actually look.
Was it really garbage collection thrashing?
The tool I reached for last time was the --trace-gc flag, which prints a line to stdout every time V8 runs a garbage collection. What I saw was a wall of lines like this:
[70190:0x138018000]  804 ms: Scavenge 10.1 (13.4) -> 8.1 (13.4) MB, pooled: 0 MB, 0.04 / 0.00 ms  (average mu = 0.993, current mu = 0.993) allocation failure;
[70190:0x138018000]  804 ms: Scavenge 10.1 (13.4) -> 8.1 (13.4) MB, pooled: 0 MB, 0.04 / 0.00 ms  (average mu = 0.993, current mu = 0.993) allocation failure;
[70190:0x138018000]  805 ms: Scavenge 10.1 (13.4) -> 8.1 (13.4) MB, pooled: 0 MB, 0.04 / 0.00 ms  (average mu = 0.993, current mu = 0.993) allocation failure;
The phrase allocation failure looks alarming, and “thrashing” was the word that jumped to mind. That was my first mistake.
So before reacting, I went and learned what each field in a GC line actually means. Node has a guide to reading --trace-gc output that breaks the line down token by token; here’s the short version, focused on the fields that mattered for this investigation:
TIP
How to read a --trace-gc line
Each line follows the same shape:
[pid:thread] <ms since start>: <GC type> <heap before> (<total>) -> <heap after> (<total>) MB, pooled: <n> MB, <pause> / <external> ms (average mu = <x>, current mu = <y>) <reason>A few fields are worth knowing. The GC type is usually Scavenge (a fast, frequent collection of the “young” generation where short-lived objects live) or Mark-Compact (a slower, full collection of the whole heap). V8’s generational design is explained nicely in Trash talk: the Orinoco garbage collector.
The <pause> ms value is the one you actually care about: how long the program was paused for that collection (the second number is time spent in external/embedder callbacks, almost always 0.00 here). And average mu is mutator utilization, the fraction of time your own code (the “mutator”) got to run rather than the collector. An average mu close to 1.0 means GC is barely stealing any CPU — but treat it as a rough gauge, not gospel: V8 derives it from major (Mark-Compact) collection pacing over a sliding window, so in a scavenge-heavy run like this one it can sit near 1.0 even while thousands of cheap minor collections quietly add up. For the real number, sum the pause times yourself, which is exactly what the script below does.
The allocation failure reason is not a bug or an error. It’s the boring, normal label V8 prints for nearly every collection. It means “a new allocation request didn’t fit in the current space, so we collected,” which is the trigger for essentially every scavenge that has ever run. Seeing it is not evidence of a problem. It’s evidence that your program allocates, which all programs do.
My second mistake was counting log lines instead of measuring their cost. So I set up a proper comparison.
Profiling against the full 994MB file is impractical (the original pipeline could run for many minutes; a bit impractical for performance analysis if I could reproduce the same results with a smaller input). So I cut a representative slice of the first 10,000,000 lines and ran everything on that.
❯ head -n 10000000 primes-count-100-000-000.txt > slice-10M.txt
❯ du -h slice-10M.txt
 89M	slice-10M.txt
Then I wrapped the pipeline in a tiny harness that times it with performance.now(). To isolate the transform from everything downstream, the sink is a Writable that does nothing but call its callback:
// profile.ts
import { pipeline } from 'node:stream/promises';
import { createReadStream } from 'node:fs';
import { Writable } from 'node:stream';
import { LineToNumber } from './LineToNumber.ts';

const input = process.argv[2];

// a do-nothing sink, so we measure only LineToNumber
const nullSink = new Writable({
	objectMode: true,
	write(_chunk, _encoding, callback) {
		callback();
	},
});

const start = performance.now();
await pipeline(createReadStream(input), new LineToNumber(), nullSink);
const elapsed = performance.now() - start;

// print to stdout so it rides along with the --trace-gc output
console.log(`WALL_MS=${elapsed.toFixed(0)}`);
Later, for the full-pipeline numbers, I swap nullSink for new NumberWriter({ outputDir: 'out' }) and change nothing else.
The --trace-gc output is far too noisy to eyeball when there are tens of thousands of lines, so I piped it through a small script. It counts the collections and, more importantly, sums the pause time of each one (the first value in the 0.04 / 0.00 ms field, from the callout above):
// summarize-gc.mjs
import { createInterface } from 'node:readline';

const lines = createInterface({ input: process.stdin });

let gcEvents = 0;
let timeInGcMs = 0;
let wallMs = 0;

for await (const line of lines) {
	// every GC line is either a Scavenge (young gen) or a Mark-Compact (full heap)
	if (line.includes('Scavenge') || line.includes('Mark-Compact')) {
		gcEvents++;
		// "..., 0.04 / 0.00 ms ..." -> the first value is the pause for this collection
		const match = line.match(/([\d.]+) \/ [\d.]+ ms/);
		if (match) timeInGcMs += parseFloat(match[1]);
	}

	// the WALL_MS line printed by profile.ts
	const wall = line.match(/WALL_MS=(\d+)/);
	if (wall) wallMs = Number(wall[1]);
}

console.log({
	gcEvents,
	timeInGcMs: Math.round(timeInGcMs),
	wallMs,
	gcPercent: +((timeInGcMs / wallMs) * 100).toFixed(1),
});
Now pipe the trace straight into the summarizer. Here’s the transform completely on its own, feeding the do-nothing sink so the only thing being measured is LineToNumber:
❯ node --trace-gc profile.ts slice-10M.txt | node summarize-gc.mjs
{
  gcEvents: 33717,
  timeInGcMs: 1433,
  wallMs: 36883,
  gcPercent: 3.9
}
There’s the thrashing, quantified: 33,717 garbage collections to chew through 10M lines. That is a lot of collections. But look at timeInGcMs. All 33,717 of them combined cost 1,433 ms out of 36,883 ms, which is just 3.9% of the runtime. The tens-of-thousands-of-lines wall of GC output scared me, when it barely had any impact at all. Node.js’ guide reduces the whole question to one line — when GC is running, your code is not — with a simple ratio for the gut-check: you’re starving the program when the time in GC rivals the time between collections, and healthy when the gap is wide. Mine was a 96-to-4 gap.
So the diagnosis was wrong. GC wasn’t thrashing the program to a halt. It was quietly doing its job in the background while something else burned the other 96% of the time. The 33,717 collections were a symptom of all that allocation, not the cost of it. The real cost was the allocation work itself: copying bytes into fresh Buffers with Buffer.copyBytesFrom(), decoding them into strings, running parseInt on each, and then pushing 10 million individual objects through the stream one at a time.
There’s also a wrinkle in my own arithmetic worth owning. I’d counted three allocations per line — slice, string, number — but only two are real. When I went to actually tally the garbage, the parsed number wasn’t on the heap at all. V8 stores small integers as SMIs, tagged inline, never allocated. The churn was the slice and the string; the number was free the whole time.
NOTE
What is an SMI?
SMI is short for “small integer.” Rather than box every number on the heap, V8 stores small integers directly inside the value’s pointer slot, tagged so the engine knows it’s an integer and not a real pointer. No heap object, no garbage to collect. You can read the gory details in V8’s Pointer Compression post.
The catch is the range. With pointer compression enabled (as it is in Chrome), an SMI is 31 bits, so the range is roughly (about 1.07 billion). My largest prime is bigger than that, which had me worried. But Node ships its official 64-bit builds with pointer compression turned off, which gives SMIs the full 32-bit range of (2,147,483,647). You can confirm it yourself:
❯ node -p "process.config.variables.v8_enable_pointer_compression"
0
So 2,038,074,743 squeaks in under the 2,147,483,647 ceiling and parseInt allocates nothing.
TIP
Verify it yourself
You don’t have to take the docs on faith. Run Node with --allow-natives-syntax and the %DebugPrint intrinsic prints a value’s actual representation:
❯ node --allow-natives-syntax -e "%DebugPrint(2147483647)"
DebugPrint: Smi: 0x7fffffff (2147483647)
❯ node --allow-natives-syntax -e "%DebugPrint(2147483648)"
DebugPrint: 0x…: [HeapNumber] in OldSpace
2147483647 is the largest integer that fits in an SMI; one more and it spills onto the heap as a HeapNumber. That ceiling is exactly why pointer compression being off matters above.
Optimizing the parse transform
Even though this is only a small fraction of the overall performance, there is still a useful optimization and fix to reduce the GC churn. An integer is just its digits. I don’t need a Buffer slice or a string to turn the bytes 49 50 51 into the number 123. I can fold the digits into an accumulator as I scan:
acc = acc * 10 + (byte - 48); // 48 is the ASCII code for '0'When I hit a newline, the accumulator is the number. Push it, reset to zero, keep going. And there’s a neat bonus: that accumulator naturally survives across chunk boundaries. The old code needed a #prev buffer to stitch the half-line at the end of one chunk onto the start of the next. With an accumulator, a half-parsed number is just a partially-accumulated integer. I carry the number itself across the boundary, not the bytes.
import { Transform, type TransformCallback } from 'node:stream';

export class LineToNumber extends Transform {
	#acc = 0;
	#inNumber = false;

	constructor() {
		super({ readableObjectMode: true });
	}

	_transform(chunk: Buffer, _encoding: string, callback: TransformCallback) {
		let acc = this.#acc;
		let inNumber = this.#inNumber;

		for (let i = 0; i < chunk.length; i++) {
			const byte = chunk[i];
			if (byte === 10) { // newline: the accumulator is the number
				if (inNumber) {
					this.push(acc);
					acc = 0;
					inNumber = false;
				}
			} else { // ASCII digit: fold it in
				acc = acc * 10 + (byte - 48);
				inNumber = true;
			}
		}

		this.#acc = acc;
		this.#inNumber = inNumber;
		callback(null);
	}

	_flush(callback: TransformCallback) {
		if (this.#inNumber) {             // a final line with no trailing newline
			this.push(this.#acc);
			this.#inNumber = false;
		}
		callback(null);
	}
}
No slice. No string. No parseInt. No #prev. There is zero per-line heap allocation. This was a learning moment for me. I’d assumed every let and every intermediate value was an allocation. It isn’t. acc lives in a register or a stack slot, the digit arithmetic produces no objects, the byte reads are off the existing chunk, and a small-integer result is an SMI (tagged inline, never on the heap). It went from two heap objects per line to zero, and the parsing didn’t go anywhere. As a bonus, the entire careful discussion from the last post about copying slices so the readable queue doesn’t pin the original chunk in memory simply evaporates, because there are no slices to retain.
NOTE
I keep the #inNumber flag to distinguish “I’ve seen digits and am building a number” from “I haven’t started one yet,” so that a blank line or a trailing newline doesn’t push a spurious 0.
Same comparison, same slice:
| pipeline | wall time | GC events | time in GC |
|---|---|---|---|
old LineToNumber → null sink | 36,883 ms | 33,717 | 1,433 ms |
new LineToNumber → null sink | 511 ms | 6 | 2 ms |
The transform went from 36.9 seconds to 0.5 seconds, about 72x faster, and the 33,717 garbage collections dropped to 6. The GC “thrashing” is gone. But notice that eliminating it only directly accounts for about 1.4 seconds of the 36-second improvement. The other ~35 seconds were the allocating, copying, and decoding I stopped doing.
I had my efficient parsing transform, then I plugged it back into the actual pipeline.
Was the Garbage Collector a red herring?
await pipeline(
	createReadStream(slice),
	new LineToNumber(), // the new 72x-faster version
	new NumberWriter({ outputDir: 'out' }),
);| pipeline | wall time | GC events |
|---|---|---|
old LineToNumber → NumberWriter | 133,891 ms | 4,689 |
new LineToNumber → NumberWriter | 80,649 ms | 397 |
A 72x faster transform made the full pipeline only 1.66x faster. It went from 134 seconds to 81 seconds. Still well over a minute to process 89MB. My beautiful zero-allocation parser shaved off the ~36 seconds it was responsible for, and then the pipeline still took over a minute anyways.
Optimizing for the GC was great. It made a significant improvement already, but there was clearly more to do. To find where the other eighty seconds actually went, I needed to look at the whole process. So I reached for a flame graph.
@platformatic/flame makes this painless. It wraps a normal run, samples the CPU for the entire duration, and on exit writes an interactive flamegraph (HTML) and a markdown hotspot report:
❯ npm install -g @platformatic/flame
❯ flame run profile.ts
🔥 CPU flamegraph generated: cpu-profile-….html
🔥 CPU markdown generated: cpu-profile-….md
Here’s the flamegraph of the pipeline:
TIP
How to read a flame graph
Each box is a function, sitting on top of the function that called it. So height is call-stack depth and the bottom row is the entry point. The one thing to internalize: width is the only quantitative axis. A box’s width is the share of CPU samples that function was on the stack for, which is a stand-in for time spent. Left-to-right is not time order; it’s just an arbitrary (here, alphabetical) layout.
You read it by scanning for wide boxes, especially wide ones near the top: a frame that’s wide at the top was actually executing, not just waiting on something it called. One stack that stays wide all the way down is a single hot path; a flat, spread-out graph means the time is scattered. That’s the whole skill, really: wide is expensive, narrow is cheap, and you hunt for the widest plateau.
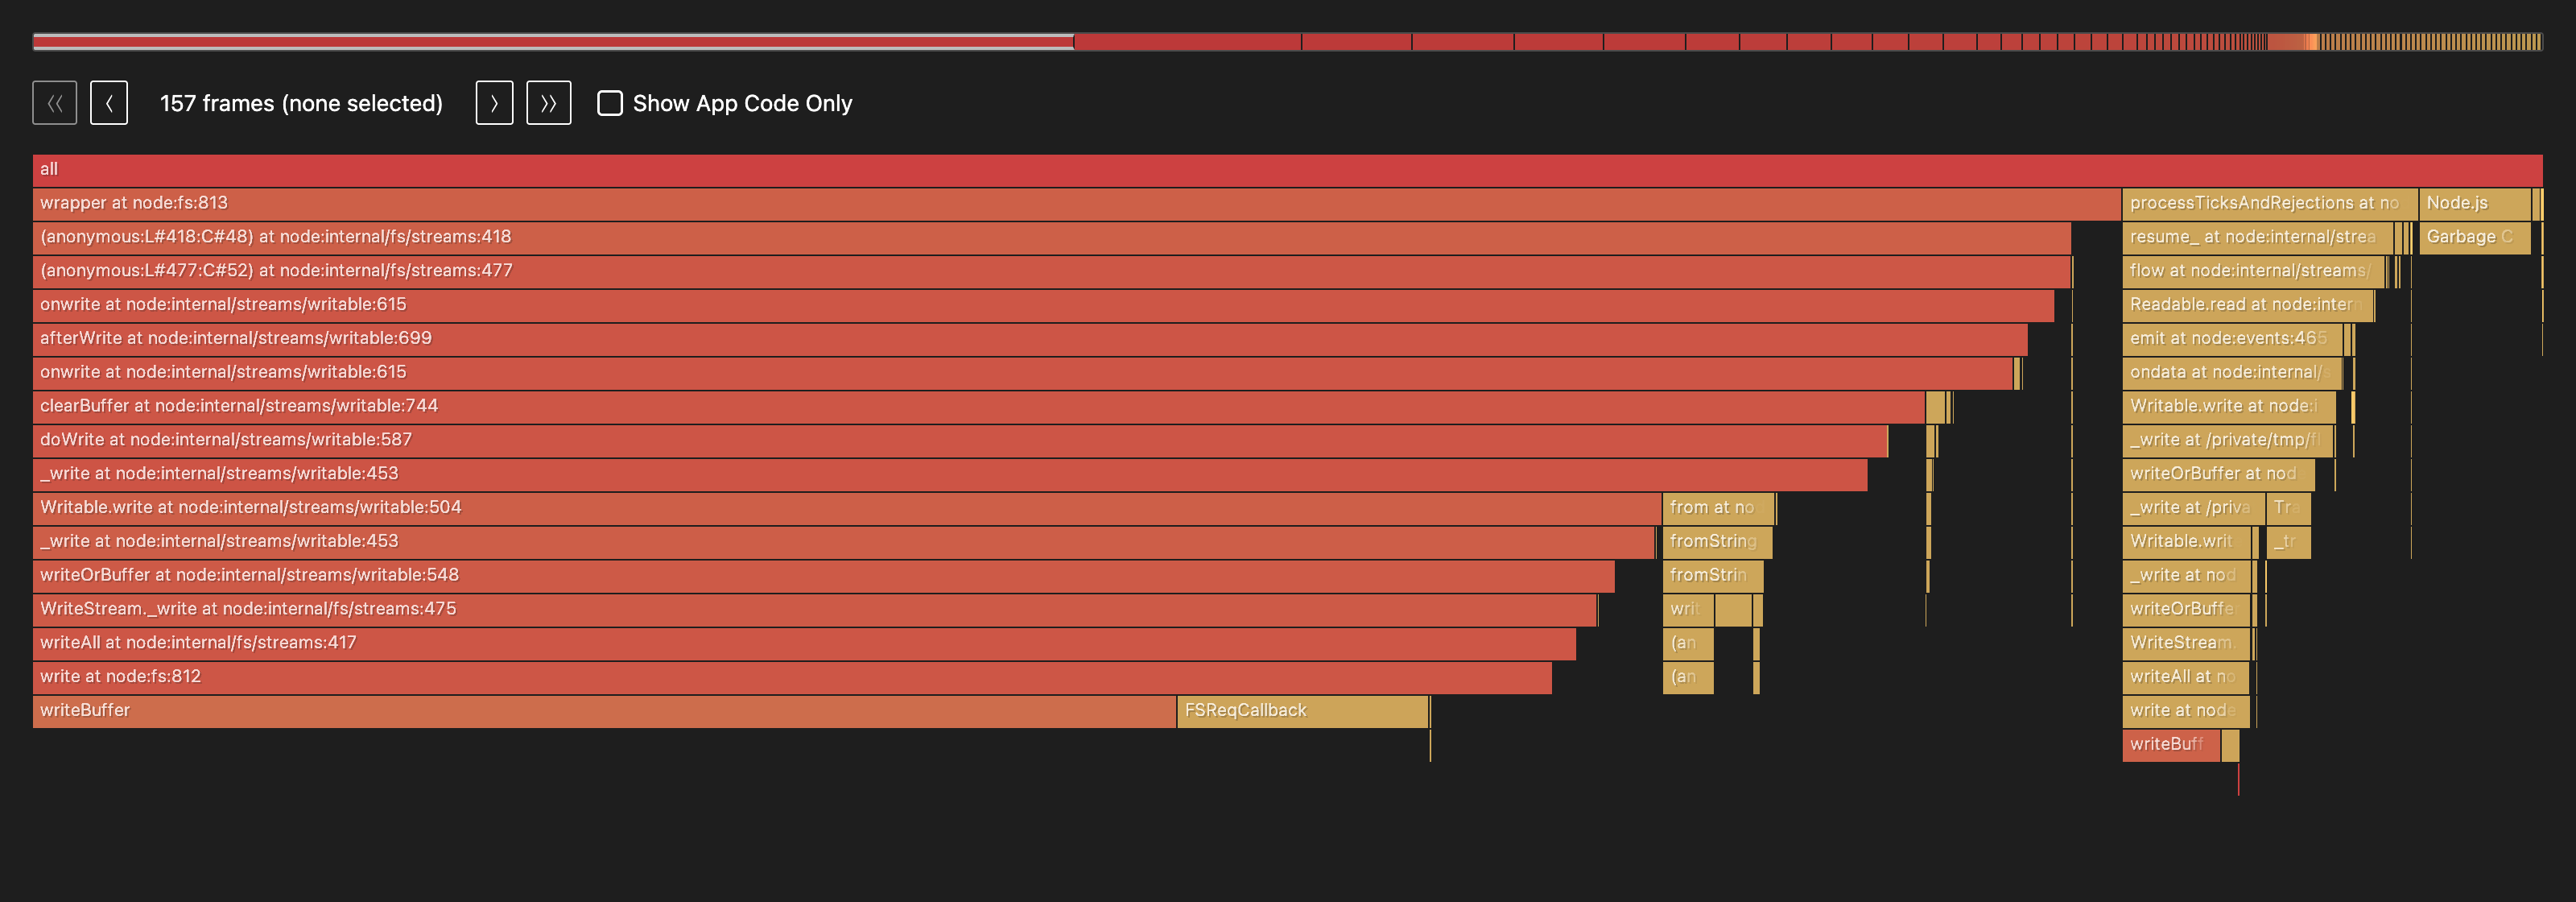
The shape alone tells the story: one stack dominates nearly the entire width. And where the labels are legible, every frame in that tower is a write call — onwrite → afterWrite → clearBuffer → doWrite → _write → Writable.write → WriteStream._write → writeAll → write → writeBuffer.
That picture is where my quoted percentages come from: the markdown report flame drops next to the HTML is the same profile as a table.
Raw flame CPU report — before
# PPROF Analysis: CPU

**Profile:** `cpu-profile-2026-06-02T05-00-04-140Z.pb`
**Duration:** 94.0s | **Samples:** 116 | **Type:** sample (count)

## Top Hotspots (by self-time)

| Rank | Function | Self% | Cum% | Location |
|------|----------|-------|------|----------|
| 1 | `writeBuffer` | 49.5% | 49.5% | `<native>` |
| 2 | `FSReqCallback` | 10.7% | 10.7% | `<native>` |
| 3 | `write` | 5.3% | 65.7% | `node:fs:812` |
| 4 | `Garbage Collection` | 4.5% | 4.5% | `<native>` |
| 5 | `_write` | 4.0% | 78.9% | `streams.mjs:63` |
| 6 | `onwrite` | 3.8% | 80.9% | `writable:615` |
| 7 | `_write` | 2.5% | 73.2% | `writable:453` |
| 8 | `(anonymous)` | 2.2% | 2.2% | `<native>` |
| 9 | `FastBuffer` | 2.0% | 2.0% | `buffer:960` |
| 10 | `wrapper` | 1.9% | 83.1% | `node:fs:813` |

## Critical Paths (top cumulative chains)

1. **[83.1%]** `(anonymous:L#418:C#48)` → `(anonymous:L#477:C#52)` → `onwrite` → `afterWrite` → `onwrite` → `clearBuffer` → `doWrite` → `_write` → `Writable.write` → `_write` → `writeOrBuffer` → `WriteStream._write` → `writeAll` → `write` → `writeBuffer`
2. **[11.8%]** `resume_` → `flow` → `Readable.read` → `emit` → `ondata` → `Writable.write` → `_write` → `writeOrBuffer` → `_write` → `Writable.write` → `_write` → `writeOrBuffer` → `WriteStream._write` → `writeAll` → `write` → `writeBuffer`
3. **[10.0%]** `(anonymous:L#418:C#48)` → `(anonymous:L#477:C#52)` → `onwrite` → `afterWrite` → `onwrite` → `clearBuffer` → `doWrite` → `_write` → `Writable.write` → `_write` → `writeOrBuffer` → `WriteStream._write` → `writeAll` → `write` → `FSReqCallback`
4. **[4.5%]** `Garbage Collection`

## Key Observations

- Native `writeBuffer` dominates (**49.5%** self-time)
- Native code accounts for **66.9%** of self-time
- 2 distinct paths converge at `write`
Its two most useful sections are per-function self-time (time spent in a function, excluding its callees) and the critical paths (heaviest call chains). Trimmed to the top few rows:
| Function | Self% | Cum% | Location |
|---|---|---|---|
writeBuffer | 49.5% | 49.5% | <native> |
FSReqCallback | 10.7% | 10.7% | <native> |
write | 5.3% | 65.7% | node:fs |
Garbage Collection | 4.5% | 4.5% | <native> |
_write | 4.0% | 78.9% | NumberWriter |
Native file-write code is 66.9% of the samples, writeBuffer alone at 49.5%. The optimized parser doesn’t even crack the top ten. And Garbage Collection is only 4.5%. If I had started with the flame graph, I would’ve never even assumed the garbage collector was an issue.
The spike sits entirely inside NumberWriter’s write path, so I finally stopped guessing and went to read that code. The number-carrying half of the pipeline runs in object mode: LineToNumber is constructed with readableObjectMode: true, so only its output side emits objects (the input side stays in byte mode, happily consuming those 64KB Buffer chunks from createReadStream), and NumberWriter runs in full object mode to accept them. On that object-mode boundary, NumberWriter._write runs once for every single number:
const line = number.toString() + '\n';
const buffer = Buffer.from(line, 'utf8');
// ...
this.#currentStream.write(buffer, callback); // one tiny write, then wait
That callback is backpressure working exactly as designed: the writer signals “I’ve accepted this number, send the next one” only after the underlying file write is acknowledged. It’s correct, and it’s the whole reason the last post’s pipeline never ran out of memory. But it means every number makes a full round trip through the event loop. Push one object, write one ~10-byte buffer, wait for the callback, repeat. Ten million times for the slice, a hundred million for the real file. The work per item is trivial, the per-item overhead is crushing.
TIP
What is object mode, and why does it cost so much here?
By default, Node.js streams move Buffer (or string) chunks around. Turning on objectMode lets a stream pass arbitrary JavaScript values instead, which is what lets LineToNumber emit numbers and NumberWriter accept them.
The convenience has a price. In object mode the stream’s internal buffering is counted in number of objects, not bytes, and every object is an individual unit of work: one push, one _write call, one callback. When each unit does almost nothing (write 10 bytes), the bookkeeping around it dominates. Object mode is wonderful for ergonomics and terrible for tiny, high-frequency items.
Fixing the actual bottleneck: batching the writes
If the cost is per-item overhead, the fix is to do fewer, bigger writes.
The cheapest idea comes first. NumberWriter is in object mode with the default highWaterMark of 16 objects, so what if I just raise it? A bigger queue should mean fewer, fatter writes. So I bumped it to 4,096 and reran:
| writer | wall time |
|---|---|
single-number writer, highWaterMark: 16 | 9,593 ms |
single-number writer, highWaterMark: 4096 | 9,316 ms |
Nothing — the two are within noise of each other. (Measured on a smaller slice that fits in a single output file, to isolate the writer; absolute times wander run to run, so the point is that the two are identical, not their exact value.) And the reason is the lesson. highWaterMark only controls how many items are allowed to queue up before backpressure kicks in. It says nothing about how they come back out. In this implementation, Node drains the queue by calling _write once per item, exactly as before. I’d made the bucket bigger and kept the same one-at-a-time spout.
The bucket only pays off if something empties it in bulk, and Node has a purpose-built tool for that: _writev. It is also exactly the right shape for the problem. The entire reason NumberWriter accepts numbers at all is so a producer like the primeGenerator() from the last post can pipe straight in, one prime at a time:
await pipeline(
	primeGenerator({ count: 100_000_000 }),
	new NumberWriter({ outputDir: 'out' }),
);
primeGenerator yields one prime at a time; that is its nature. Batching is something the writer wants for its own efficiency, and _writev lets it batch internally without that ever leaking into the contract every producer has to satisfy.
TIP
What is _writev?
A Writable can optionally implement _writev(chunks, callback) alongside _write. When more than one chunk is queued at the moment the stream is ready to write, Node hands you the whole array of queued chunks in one _writev call instead of replaying them one at a time through _write. You implement both: _write for the single-item case, _writev for the batch.
The batching is automatic and invisible to the producer. Chunks only pile up when writes can’t be retired instantly, which is precisely when NumberWriter is busy waiting on a file write. So the producer keeps calling .write(oneNumber), and Node hands NumberWriter whatever accumulated during the last file write, all at once.
Now highWaterMark finally earns its keep. Raising it did nothing on its own, because nothing drained the queue in bulk; now that _writev does, the watermark sets how many numbers land in each batch. The producer fills the queue up to the mark, backpressure pauses it, the in-flight file write completes, _writev flushes the whole queued batch, and the producer resumes. So this time, raising it actually matters:
super({ objectMode: true, highWaterMark: 4096 });Both _write and _writev delegate to one routine that walks the batch, writing as many numbers as fit in the current file before rotating. This is where the file-rotation logic from the last post comes into play: a coalesced batch can straddle a maxFileSize boundary, so we write what fits, rotate, and continue with the remainder.
_write(number: unknown, _encoding: any, callback: Callback): void {
	this.#writeFrom([{ chunk: number }], 0, callback);
}

_writev(chunks: Array<{ chunk: unknown }>, callback: Callback): void {
	this.#writeFrom(chunks, 0, callback);
}

#writeFrom(chunks: Array<{ chunk: unknown }>, start: number, callback: Callback): void {
	let line = '';
	let bytes = 0;
	let i = start;

	for (; i < chunks.length; i++) {
		const n = chunks[i].chunk;
		if (typeof n !== 'number' || !Number.isFinite(n)) {
			return callback(new Error(`Unexpected chunk type ${typeof n}`));
		}
		const piece = n.toString() + '\n';
		const pieceBytes = Buffer.byteLength(piece);

		// if this number would overflow the current file, stop and rotate first
		if (bytes > 0 && this.#currentStream.bytesWritten + bytes + pieceBytes > this.#maxFileSize) {
			break;
		}
		line += piece;
		bytes += pieceBytes;
	}

	const remaining = i < chunks.length;
	this.#currentStream.write(Buffer.from(line, 'utf8'), (err) => {
		if (err) return callback(err);
		if (!remaining) return callback(null);

		this.#currentStream.end(() => {
			this.#currentStream.removeAllListeners();
			this.#openNextFile((e) => {
				if (e) return callback(e);
				this.#writeFrom(chunks, i, callback); // continue with the overflow
			});
		});
	});
}
LineToNumber does not change at all. It is still the single-number accumulator from earlier, still pushing one number at a time. All of the batching now lives inside NumberWriter, and primeGenerator pipes straight in.
I instrumented _writev to report what it actually saw, and the batching is real: across the 10M numbers it was called 2,442 times with an average batch of 4,094 (right at the highWaterMark), plus the lone single _write that kicks off each cycle. Here is the run on the same slice, against the single-number writer:
| pipeline | wall time | GC events | time in GC |
|---|---|---|---|
| new transform → single-number writer | 80,649 ms | 397 | 184 ms |
new transform → _writev writer (hwm 4096) | 1,452 ms | 119 | 42 ms |
80.6 seconds to 1.45 seconds, about 55x faster, and primeGenerator can still feed it one prime at a time. The writer can batch without changing the producer.
And the flame graph makes the win impossible to mistake. Here’s the same pipeline profiled the same way, now with the _writev writer:
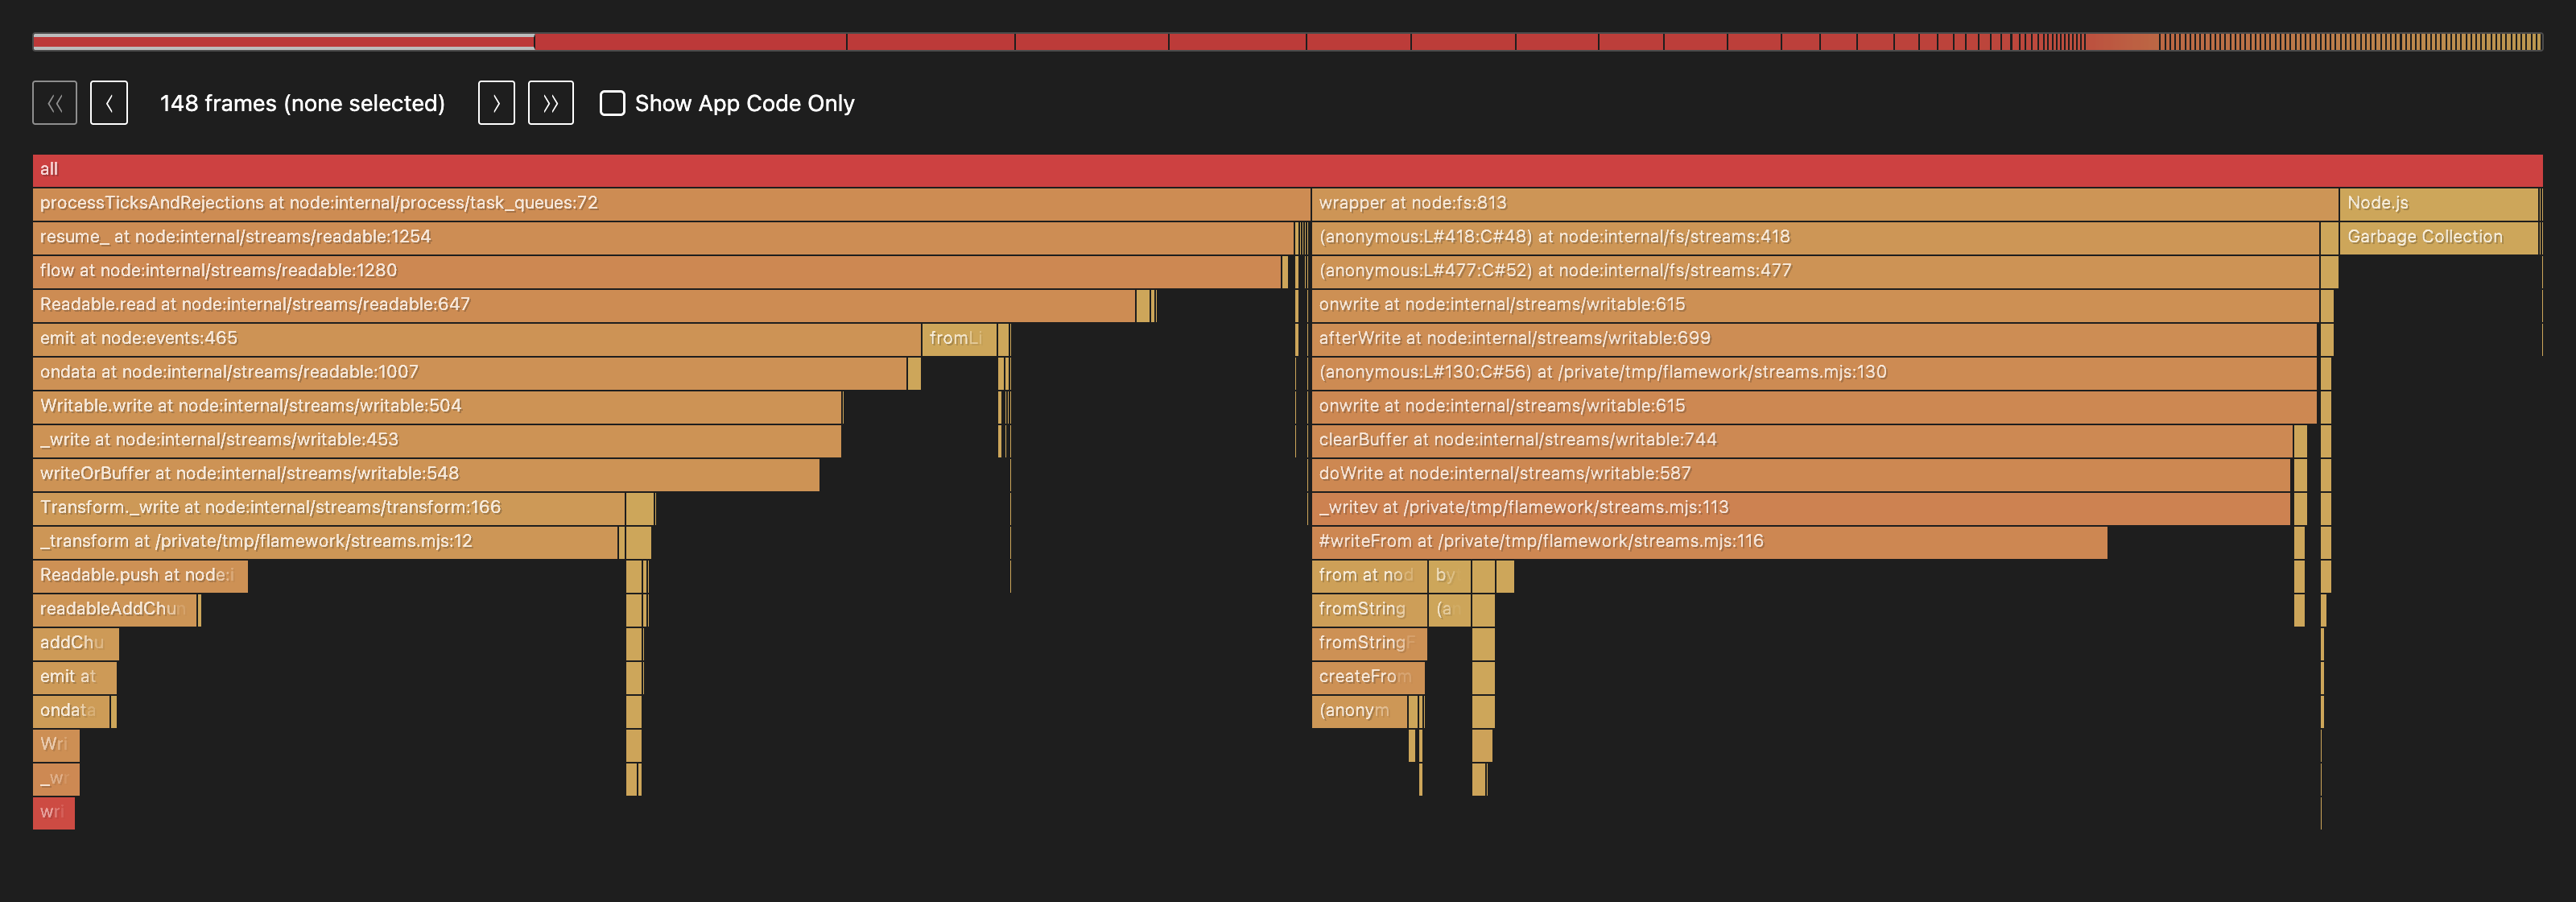
The giant write tower is gone; writeBuffer doesn’t even appear in the top ten anymore. What remains splits into two shorter stacks, reading-and-parsing on one side and the batched write on the other, and the hotspot report shows the bottleneck didn’t just shrink, it moved:
| Function | Self% | Cum% | Location |
|---|---|---|---|
#writeFrom | 23.9% | 33.0% | NumberWriter |
_transform | 14.9% | 23.8% | LineToNumber |
writeOrBuffer | 9.1% | 33.4% | writable |
Garbage Collection | 7.9% | 7.9% | <native> |
_writev | 7.3% | 39.1% | NumberWriter |
Raw flame CPU report — after
# PPROF Analysis: CPU

**Profile:** `cpu-profile-2026-06-02T05-00-06-740Z.pb`
**Duration:** 1.5s | **Samples:** 71 | **Type:** sample (count)

## Top Hotspots (by self-time)

| Rank | Function | Self% | Cum% | Location |
|------|----------|-------|------|----------|
| 1 | `#writeFrom` | 23.9% | 33.0% | `streams.mjs:116` |
| 2 | `_transform` | 14.9% | 23.8% | `streams.mjs:12` |
| 3 | `writeOrBuffer` | 9.1% | 33.4% | `writable:548` |
| 4 | `Garbage Collection` | 7.9% | 7.9% | `<native>` |
| 5 | `_writev` | 7.3% | 39.1% | `streams.mjs:113` |
| 6 | `(anonymous)` | 5.7% | 5.7% | `<native>` |
| 7 | `Readable.read` | 5.2% | 44.2% | `readable:647` |
| 8 | `flow` | 5.0% | 49.9% | `readable:1280` |
| 9 | `ondata` | 4.5% | 35.9% | `readable:1007` |
| 10 | `readableAddChunkPushObjectMode` | 3.4% | 7.1% | `readable:516` |

## Critical Paths (top cumulative chains)

1. **[50.9%]** `resume_` → `flow` → `Readable.read` → `emit` → `ondata` → `Writable.write` → `_write` → `writeOrBuffer` → `Transform._write` → `_transform` → `Readable.push` → `readableAddChunkPushObjectMode` → `addChunk` → `emit` → `ondata` → `Writable.write` → `_write` → `writeOrBuffer`
2. **[40.2%]** `(anonymous:L#418:C#48)` → `(anonymous:L#477:C#52)` → `onwrite` → `afterWrite` → `(anonymous:L#130:C#56)` → `onwrite` → `clearBuffer` → `doWrite` → `_writev` → `#writeFrom` → `from` → `fromString` → `fromStringFast` → `createFromString` → `(anonymous)`
3. **[7.9%]** `Garbage Collection`

## Key Observations

- `#writeFrom` is the top hotspot (**23.9%** self-time)
- Application code accounts for **79.8%** of self-time (optimizable)
With the file writes batched, 79.8% of the remaining time is now my own code: #writeFrom building each batch’s buffer (string concatenation plus one Buffer.from) and _transform folding digits. The framework plumbing that ate eighty seconds has become a rounding error. Garbage Collection ticks up to 7.9% here, but that’s 7.9% of a one-and-a-half-second run, not an eighty-second one. It’s a bigger slice of a much smaller pie. If I wanted to push further, that #writeFrom string-building is the obvious next target, but at a 55x speedup I’m content.
Every variant’s output is byte-for-byte identical to the input file, including the rotation that lands in the middle of a batch.
NOTE
Could you go faster? Yes, by changing the contract.
There is one more rung on the ladder: have LineToNumber emit number[] arrays and teach NumberWriter to accept them. On my slice that runs about 2x faster again. The reason is the same object-mode insight from above. _writev only batches the writes, so all 10 million numbers still cross the object-mode boundary one at a time, whereas pushing arrays crosses it only a couple thousand times.
But look at what it costs: every producer now has to emit arrays, so primeGenerator can no longer pipe straight in. That is not “the same problem, optimized.” It is a different problem with a looser constraint, the same way the byte-to-byte rewrite I set aside at the start was a different problem. When you are allowed to change the interface, there is always more speed on the table. The question I actually cared about was how fast I could go without breaking the contract, and _writev is the answer: ~55x over the naive writer, with primeGenerator still feeding it one prime at a time.
What I’d tell past me
This exercise was a great learning experience. It tested a lot of assumptions I had around performance optimization and demonstrated some important lessons.
allocation failurein--trace-gcis not a smell. It’s the label on almost every collection. Don’t read the word “failure” as “problem.”- Measure cost, not count. 33,717 garbage collections sounds catastrophic and cost under 4% of the runtime. Look at time-in-GC and
average mubefore blaming the collector. Ifmuis up near 0.99, the collector is not the problem. - In object-mode pipelines, the hidden cost is usually per-item overhead, not allocation. One
pushand onewriteper item, each gated on a callback, is a full event-loop round trip. At millions of items, batching the writes is the highest-leverage change you can make, and it has nothing to do with the GC._writevlets the writer batch internally so your producers can keep emitting one item at a time. - When you genuinely must parse, parse from the bytes. Folding ASCII digits into an accumulator beats slice, decode, then
parseInton every axis: no allocation, no GC churn, no buffer-stitching across chunks, and 72x the speed. --trace-gcanswers one question; a flame graph answers “where is the time?” A GC trace can only ever tell you about GC. The instant I ran a flame graph, the whole mystery resolved into one picture: a tower of file-write machinery, the parser a 3% sliver, GC at 5.6%. Reach for the general tool before the specific one.
If you enjoyed this, the prime number generator that started this whole detour is still embarrassingly naive, and a future post will fix that. Stay tuned, and make sure to share!